How to draw graphs
This is a short introduction to how to draw graphs easily using Exel.
You are to draw three different types
of graphs using the different sets of data. The result should look similar
to the images on this page. To start the diagram guide click on ![]() ,
(klick on the
,
(klick on the ![]() in the file to start Exel if necessary). Read the instructions below before
you start working.
in the file to start Exel if necessary). Read the instructions below before
you start working.
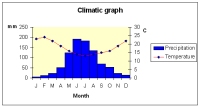
The climatic graph
should be made using the choices given under "Anpassade" or
"Alternatives". Try the different alternatives and see which
alternative gives rhe right result. Remember labels!
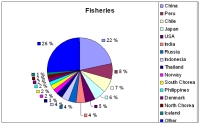
The data for the "Fisheries" are to be presented
as a pie chart.
The results registrated in the investigation in populations of
voles show a continuous change over several years. The data is
to be presented as line graphs. Remember labels!
Try all alternatives for all steps in the guide. If the changes are useful then use them in your graph. For all graphs is true that you can change the appearance of the graphs by "rightclicking" on the different parts of the diagram.
Remember the following when you write
your own results in a table:
- use only comma (not dot) for decimal numbers
- do not write anything but numbers in the cells with the data.